By: Luke Benz
January 4th, 2018
Back in November, I rolled out the YUSAG NCAA Hoops In-Game Win Probability Model. The model has been performing quite well in comparison to more established models at ESPN and kenpom.com. At the conclusion of last night’s game between Marquette and Providence, which the Golden Eagles won 95-90 in overtime, I tweeted out the following win probability chart.
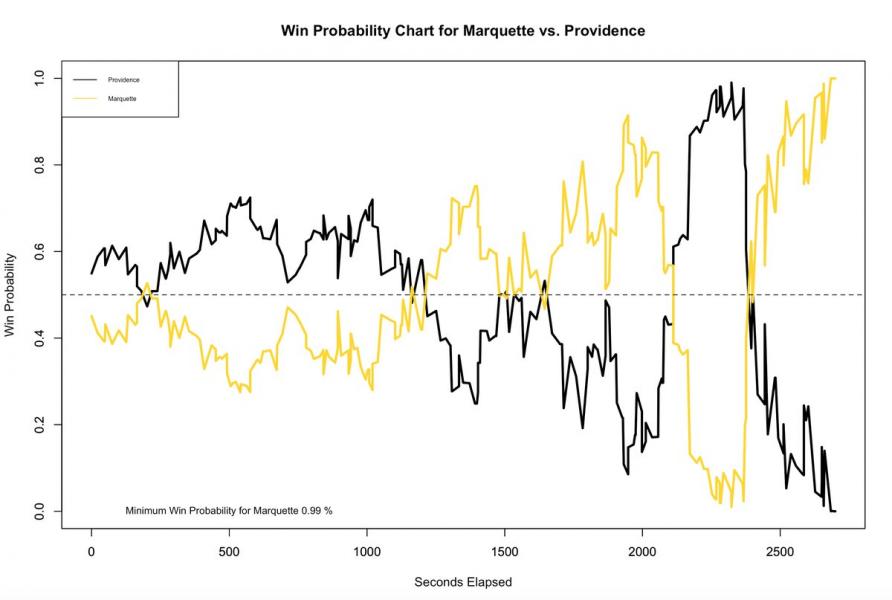
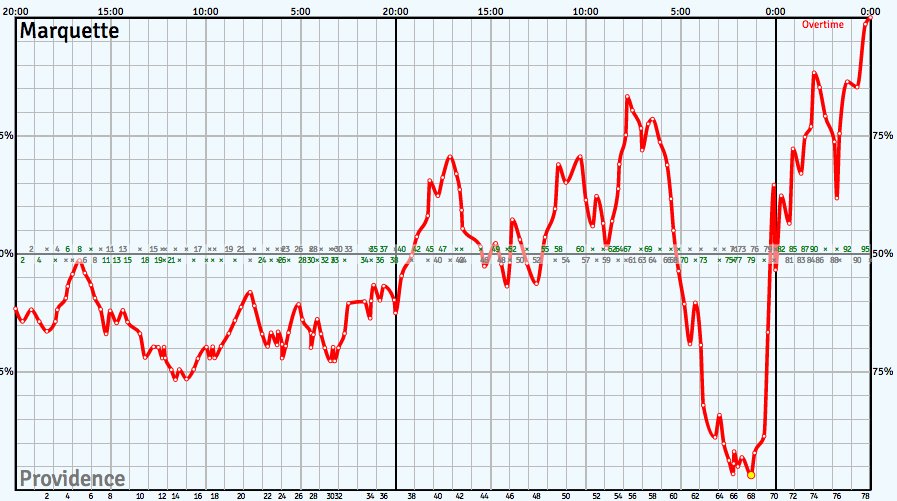
Having followed the game, I was surprised to see my model giving Marquette just a 1% chance of winning the game at their lowest point (down 6 with 1:17 to go in the second half). Sure, at that point the odds weren’t great, but I still thought that 1% was a bit low. After examining the win probability charts that Ken Pomerory and Bart Torvik made for the game, I concluded that model estimate was indeed a little bit low. All three of our models had the minimum win probability for Marquette coming with 1:17 to go in the second half, but my estimate was lower than both Bart’s (2.7%) and Ken’s (3.1%). 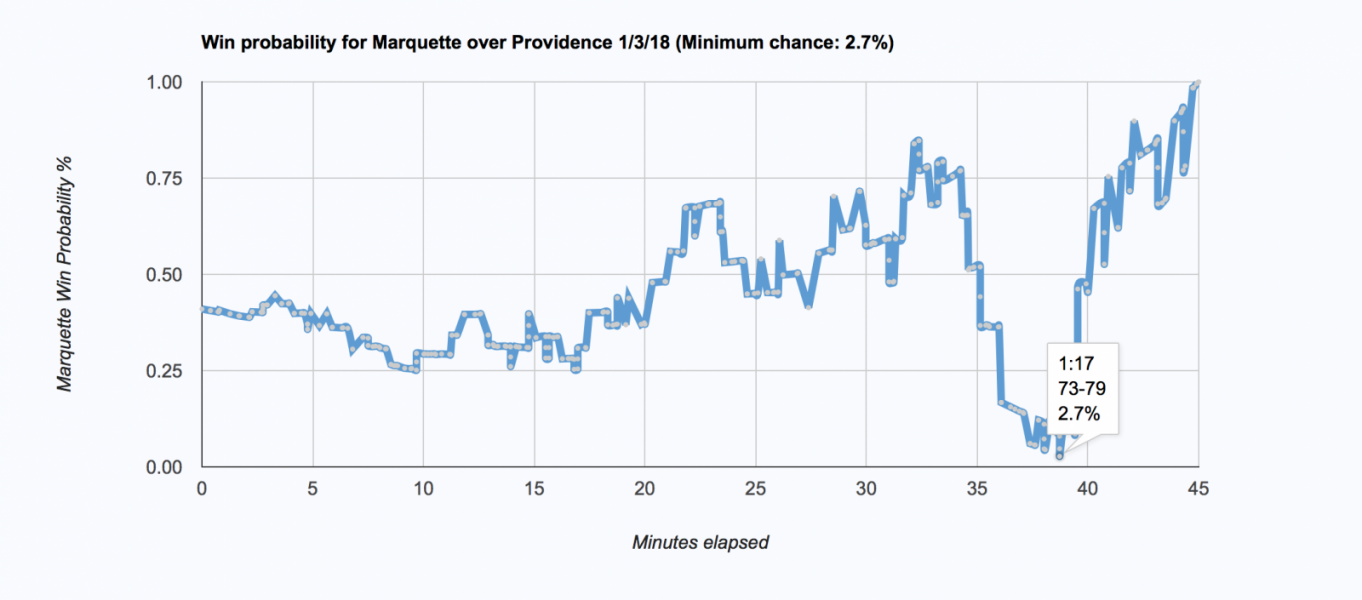
I’ll note that neither Bart’s nor my model factors in possesion, which tends to lead to underestimates in win-probability near the end of the game. Regardless, it was clear that I had some work to do, and I set off to refit my model. In refitting the model, I did two things differently than last time. The first, was that I trained my model using more data. When I first trained the win-probability model, I only used the 2016-17 season’s worth of data, while this time around, I also included the first half of the 2017-18 season. Another mistake I made when I first trained the model was removing overtime games. Games that go to overtime are ones that frequently involve some sort of last minute comeback (as was the case in the Marquette-Providence game), and it would be bad for my model to ignore these late game trends. Recharting the game between Marquette and Providence, I obtained the following win probability graph.
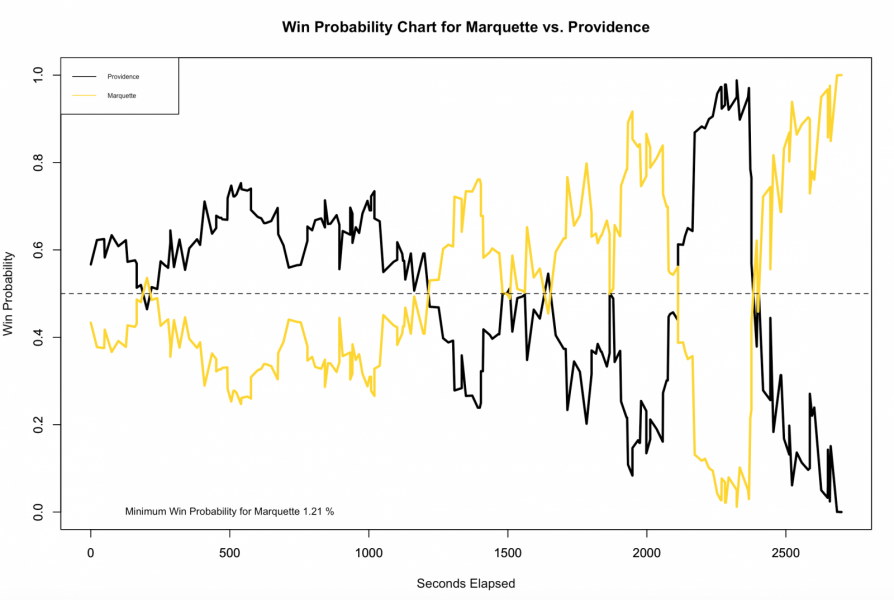
1.21% is probably still an underestimate, but clearly a step in the right direction. Going forward, I will continue to train my win probability model using more and more data, and think that once I have several seasons worth (rather than 1.5 seasons) of data, the model will converge to the end of game trends of the above (more rubust) models.
In any case, it’s pleasing to see that my model is telling the same story as those of college baskteball anaytics experts, and going forward, I’ll remeber to take small minimum win probabilities that occur near the end of the game with a grain of salt.