By: Luke Benz
January 8th, 2017
Throughout the course of the 2017-18 college basketball season, I’ve been somewhat obsessed with assist networks, diagrams and distributions of the way players on a given team assist each other’s field goals. With conference play in full swing and the season reaching it’s halfway point, I decided to examine various centrality metrics for each NCAA player in hopes of creating some “All-American” teams.
Team Breakdowns
Before breaking down player level centrality measures, I’ll look at team centrality measures in the form of graph clustering coefficient. Clustering coefficients, which range between 0-1, measure how connected a network is. A clustering coefficient of 1 would indicate that each player in the network had assisted every other player in the network, while a clustering coefficient of 0 would indicate a team had not created a single assist all season. Here are the teams with the highest clustering coefficients this season.
| Team | Clustering Coefficient |
|---|---|
| Auburn |
0.971 |
| Dayton | 0.971 |
| Colorado St. | 0.947 |
| Lehigh | 0.947 |
| Milwaukee | 0.938 |
Now, the teams with the lowest clustering coefficients.
| Team | Clustering Coefficient |
|---|---|
| UC Santa Barbara |
0.429 |
| Arkansas Pine Bluff | 0.480 |
| South Carolina St. | 0.535 |
| SIU-Edwardsville | 0.538 |
| Penn | 0.557 |
Having a high/low clustering coefficient doesn’t necessarily indicate anything about a team’s quality of play; rather it gives an indication to a team’s style of play. Teams with high clustering coefficients tend to be more balanced, while teams with lower clustering coefficients tend to be lead by 1-2 star players without a deep supporting cast. For what it’s worth, the MEAC and SWAC have the 3rd lowest and lowest mean clustering coefficients respectively among the 32 conferences.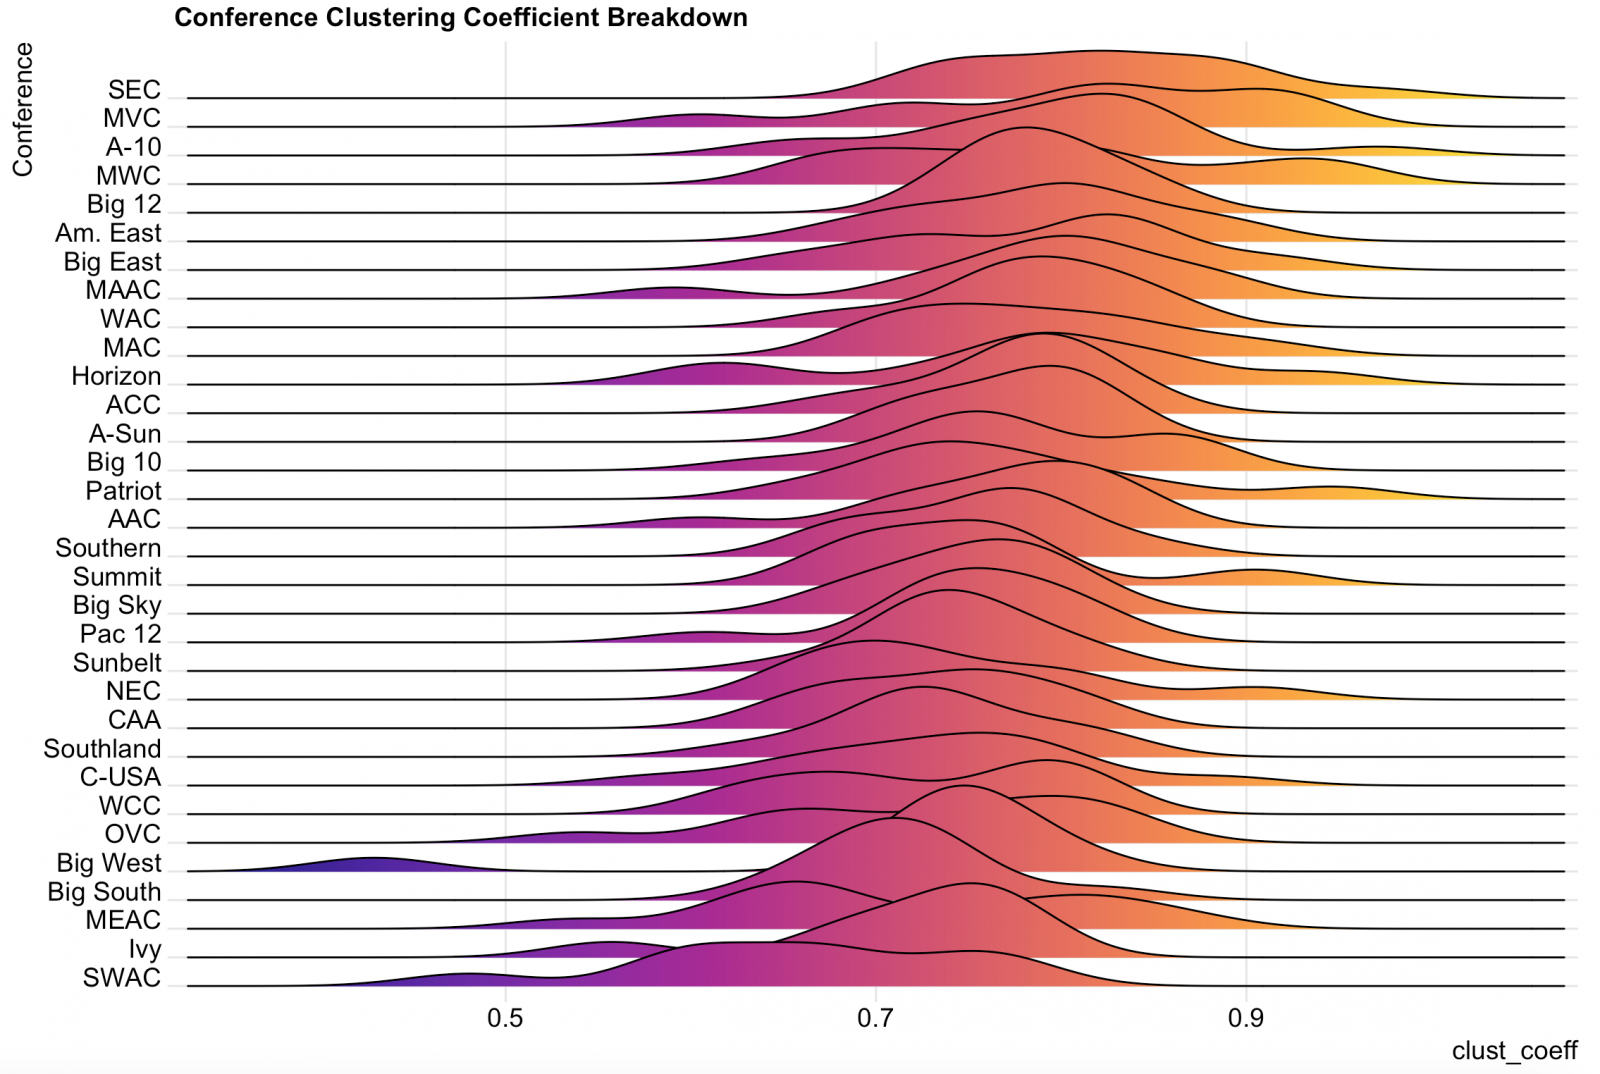
Player Breakdowns
Now, I move onto the individual awards. I will use the following 5 metrics to create “All-American Assist Teams”, though they need not be traditional 2 Forward, 3 Guard teams. Rather I will simply take the top 5 players in each category.
- Assist Frequency Percentage - The percentage of a team’s teams assists a given player is responsible for. (i.e. assister in assister –> shooter pair)
- (Assisted) Shot Frequency Percentage - The percentage of a team’s assisted field goals a player is responsible for making (i.e. shooter in assister –> shooter pair)
- PageRank: A player’s overall importance as a node in the network, calculated using the Google PageRank algorthim.
- Hub Score: A number between 0-1 indicating a player’s importance as an assister in the network.
- Authority Score: A number between 0-1 indicating a player’s importance as a receiver of assists in the network.
The 5 ”All-American Assist Teams” will be computed using both weighted and unweighted assist networks. Unweighted assist networks count every assisted field goal as equal, while weighted assist networks give 1.5 assist to assited 3-point field goals.
Unweighted ”All-American Assist Teams”
Assist Frequency Percentage
| Player | Team | Position | Asst. Freq % |
|---|---|---|---|
| Emmett Naar | Saint Mary’s | G | 57.3% |
| Nick Weiler-Babb | Iowa State | G | 56.1% |
| Trae Young | Oklahoma | G | 55.0% |
| RJ Cole | Howard | G | 53.7% |
| Darrian Ringo | Miami (OH) | G | 53.4% |
(Assisted) Shot Frequency Percentage
| Player | Team | Position | Shot. Freq % |
|---|---|---|---|
| Kobe Gantz | Delaware State | G | 57.9% |
| Chance Murray | UC Riverside | G | 52.5% |
| Kendall Small | Pacific | G | 42.4% |
| RJ Cole | Howard | G | 38.2% |
| Charles Jackson | Arkansas Pine Bluff | G | 34.9% |
PageRank
| Player | Team | Position | PageRank |
|---|---|---|---|
| Alex Larsson | UC Riverside | F | 0.376 |
| Kavon Waller | Delaware State | F | 0.331 |
| Jack Williams | Pacific | F | 0.329 |
| Max Heidegger | UC Santa Barbara | G | 0.310 |
| Travon Harper | Arkansas Pine Bluff | F | 0.281 |
Hub Score
| Player | Team | Position | Hub Score |
|---|---|---|---|
| Jonathan Stark | Murrary State | G | 0.991 |
| Trae Young | Oklahoma | G | 0.975 |
| Emmet Naar | Saint Mary’s | G | 0.971 |
| Isiah Wright | San Diego | G | 0.970 |
| Jon Davis | Charlotte | G | 0.960 |
Authority Score
| Player | Team | Position | Authority Score |
|---|---|---|---|
| Kobe Gantz | Delaware State | G | 0.968 |
| Chance Murray | UC Riverside | G | 0.947 |
| Jonathan Stark | Murray State | G | 0.924 |
| Kameron Langley | North Carolina A&T | G | 0.900 |
| Brandon Anderson | Brown | G | 0.857 |
Weighted ”All-American Assist Teams”
Assist Frequency Percentage
| Player | Team | Position | Asst. Freq % |
|---|---|---|---|
| Nick Weiler-Babb | Iowa State | G | 57.0% |
| Emmet Naar | Saint Mary’s | G | 56.2% |
| RJ Cole | Howard | G | 54.5% |
| Darrian Ringo | Miami (OH) | G | 52.4% |
| Trae Young | Oklahoma | G | 52.0% |
(Assisted) Shot Frequency Percentage
| Player | Team | Position | Shot. Freq % |
|---|---|---|---|
| Kobe Gantz | Delaware State | G | 57.1% |
| Kendall Small | Pacific | G | 46.6% |
| Chance Murray | UC Riverside | G | 46.2% |
| Gabe Vincent | UC Santa Barbara | G | 40.1% |
| RJ Cole | Howard | G | 37.8% |
PageRank
| Player | Team | Position | PageRank |
|---|---|---|---|
| Alex Larsson | UC Riverside | F | 0.354 |
| Jack Williams | Pacific | F | 0.336 |
| Kavon Waller | Delaware State | F | 0.332 |
| Max Heidegger | UC Santa Barbara | G | 0.322 |
| Taylor Funk | Saint Joseph’s | F | 0.300 |
Hub Score
| Player | Team | Position | Hub Score |
|---|---|---|---|
| Jonathan Stark | Murrary State | G | 0.994 |
| Trae Young | Oklahoma | G | 0.974 |
| Emmet Naar | Saint Mary’s | G | 0.967 |
| Isiah Wright | San Diego | G | 0.965 |
| Jon Davis | Charlotte | G | 0.962 |
Authority Score
| Player | Team | Position | Authority Score |
|---|---|---|---|
|
Artem Tavakalyan |
Delaware State | G | 0.950 |
|
Terrell Miller Jr |
Murray State | G | 0.940 |
| Max Heidegger | UC Santa Barbara | G | 0.910 |
| Alex Larsson | UC Riverside | F | 0.908 |
|
Jake Allsmiller |
Georgia Southern | G | 0.890 |
Final Thoughts
For the most part, the weighted and unweighted teams look remarkably similar outside of shuffling the order of some players. The key exception to this is the “Authority Score” team, which is entirely different when 1.5 weight is given to 3-point assists. What’s interesting to note is that many of these players, with the exception of Trae Young and Emmet Naar, are not known on the national stage, yet they are among the most valuable to their teams in the entire country. This isn’t necessarily a reflection of their talent, but rather their talent relative to the teammates. Thus, the recurrence of representatives of teams like Delaware State, Howard, Murray State, UC Riverside, and UC Santa Barbara indicates a clear talent imbalance among the core members of these teams. Perhaps most remarkable is the fact that even surrounded by good players at Oklahoma, Trae Young is on the same level relative to his teammates as the best players on some of the worst teams are to theirs. Finally, it’s worth giving a particular shout-out to Howard’s RJ Cole. Cole is responsible for (assists or makes) 92.3% of the Bison’s points off assist, making him perhaps the most valuable player in the entire nation! If you’d like to play with these assist networks, be sure to check out my app. You can also see team leaders in each of the above metrics in the attached spreadsheet.
Author’s note: Data constitutes all games played though 1/2/2018, with the exception being games that don’t have play-by-play logs available on ESPN.