Who was Good, Who was Bad, and what to Learn for Next Year
By: Daniel Tokarz, Michael Blicher, and Guna Mandava
January 5th, 2018
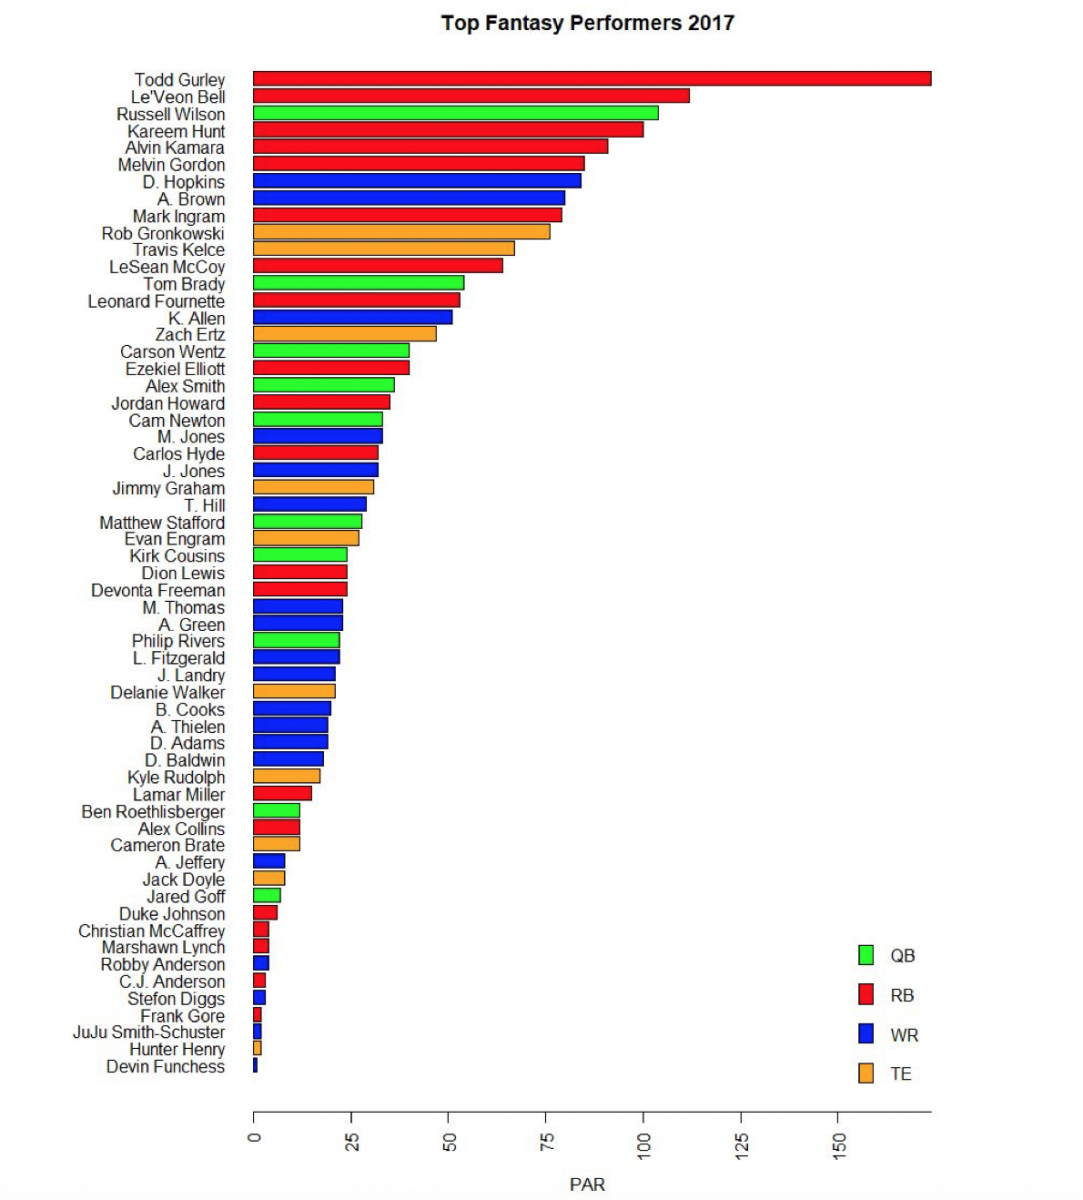
As we prepare for the arrival of the NFL playoffs this weekend, millions of Americans will be experiencing, for the first time this season, what it’s like to watch a game without any Fantasy Football implications. After experiencing another first round playoff exit this year, I decided to go back and look at the strengths and weaknesses of my team, “Light and Trubisky,” which gave me the task of analyzing Fantasy player value. If one wanted to examine the top fantasy performances of the year, one might naturally begin with total points scored, as seen in the plot below.
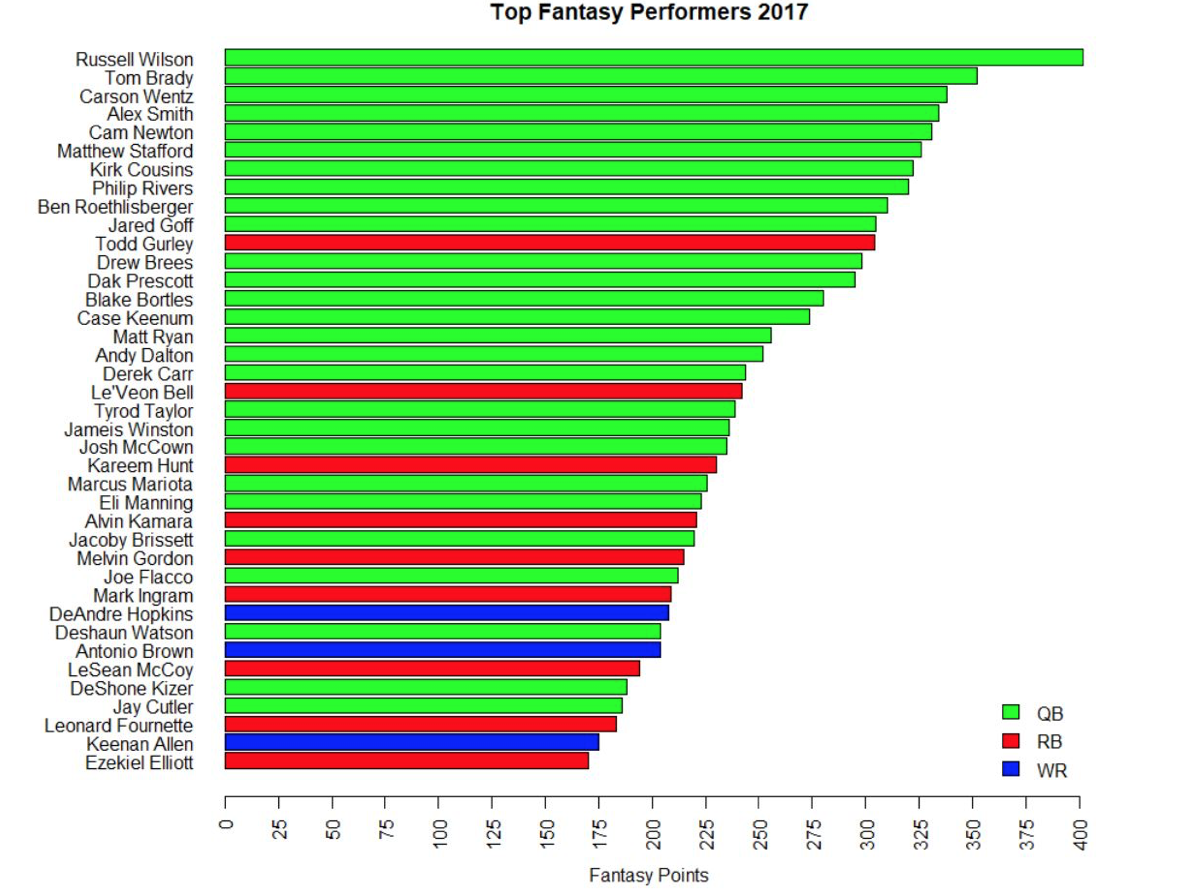
This plot shows the top Fantasy scorers for the 2017 season, based on the standard scoring method used at “The Football Database”. As we can see, QBs dominate the top of the chart, as they usually do, mainly because an average QB is responsible for more touchdowns annually than even a top RB or WR. High Scores, however are not indicative or true value, because fantasy teams are made up of players at different positions. The impossible team of 10 QBS would do quite well, but that’s not how Fantasy works. Because of this, we have to think of value comparatively, i.e. how does someone measure up to a potential replacement in the same slot.
We came up with a metric called “Points Above Replacement” or PAR. The basic idea is to measure production by comparing a player to the best available free agent at that position. Because most fantasy leagues start 1QB, 2RB, 2WR, and 1TE, we decided that a good way to start PAR would be to think of a hypothetical ten-man league with 10 QB, 20 RB, 20 WR, 10 TE starting. The PAR value we assign to a given player is their point production (as recorded by The Football Database) minus the production of the first non-starting caliber player (i.e. QB-11, RB-21, WR-21 or TE-11) for that season. For example, in 2017, the 11th highest scoring QB was Drew Brees, who finished the season with 298 points. For 2017, a QB’s PAR value would be their score minus 298. This system attempts to flatten the data by comparing a player to his theoretical replacement. Take a look at the plots below to see how PAR affects players at different Positions. The vertical lines in the true scoring plots correspond to the PAR value. 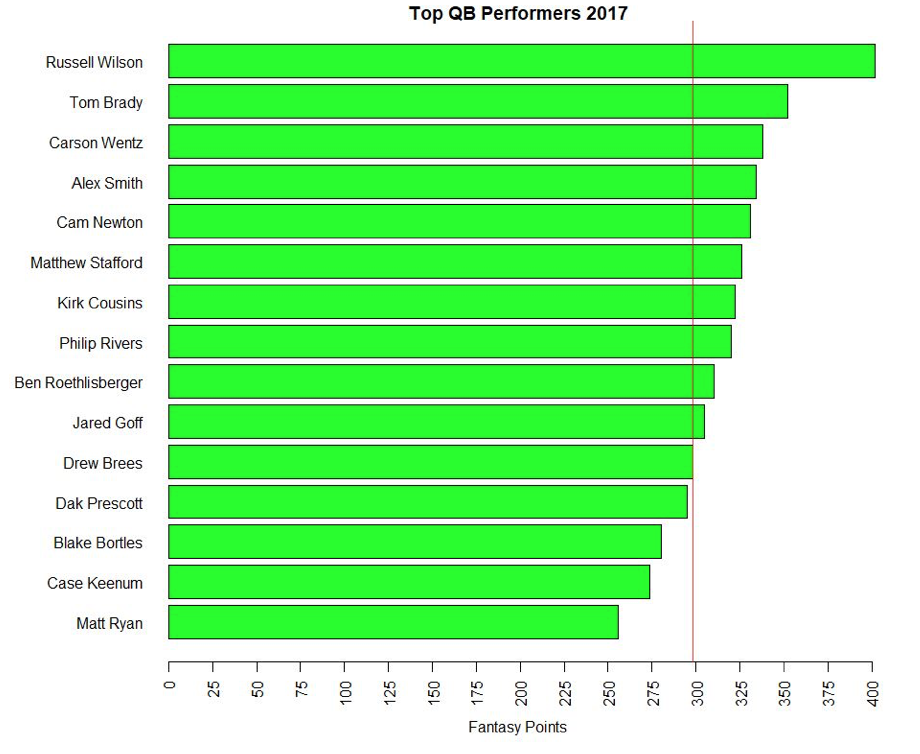
If we look at the top QBs, we can see that although they’re high scoring, they don’t score particular higher than other QBs who are starting or on the bench in a typical league, as shown in the pretty low decline in score from one QB to another.
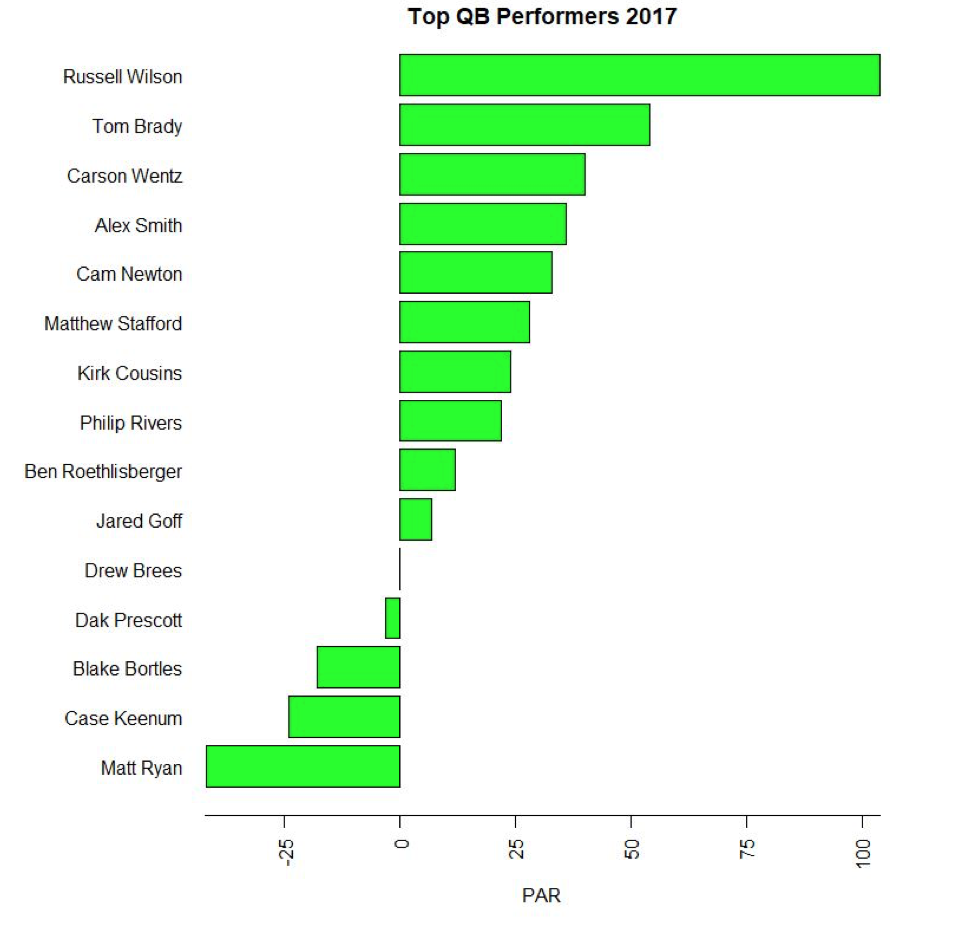
When we look at the PAR values, we see that besides Russell Wilson, who practically lapped the competition at QB this year, no other QB, even the GOAT, contributed more than about 50 more points than their theoretical replacement this year. Compare this to the RB plots and see how PAR flattens total score.
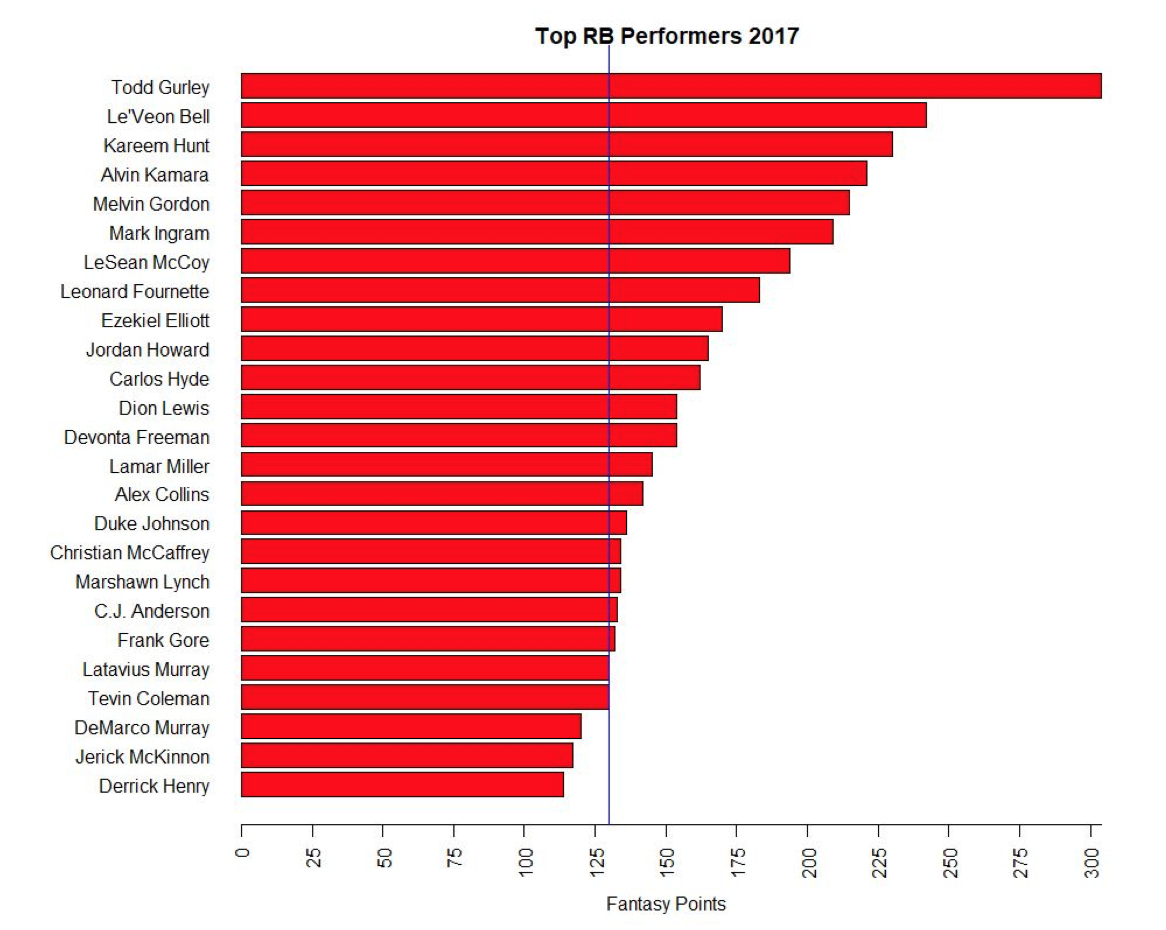
Because a typical league starts 20 RB at a time, we see that a player’s theoretical replacement is usually significantly worse if the starting player is one of the top RBs in the league.
We can see in the PAR RB plot that 8 players contributed more than 50 points above replacement to their teams, 4x as many as QBs. Although RBs typically mean less to their team’s actual success than QBs, it’s clear a top RB would bring a lot to an ailing Fantasy Team. Let’s quickly look at the plots for WRs and TEs.
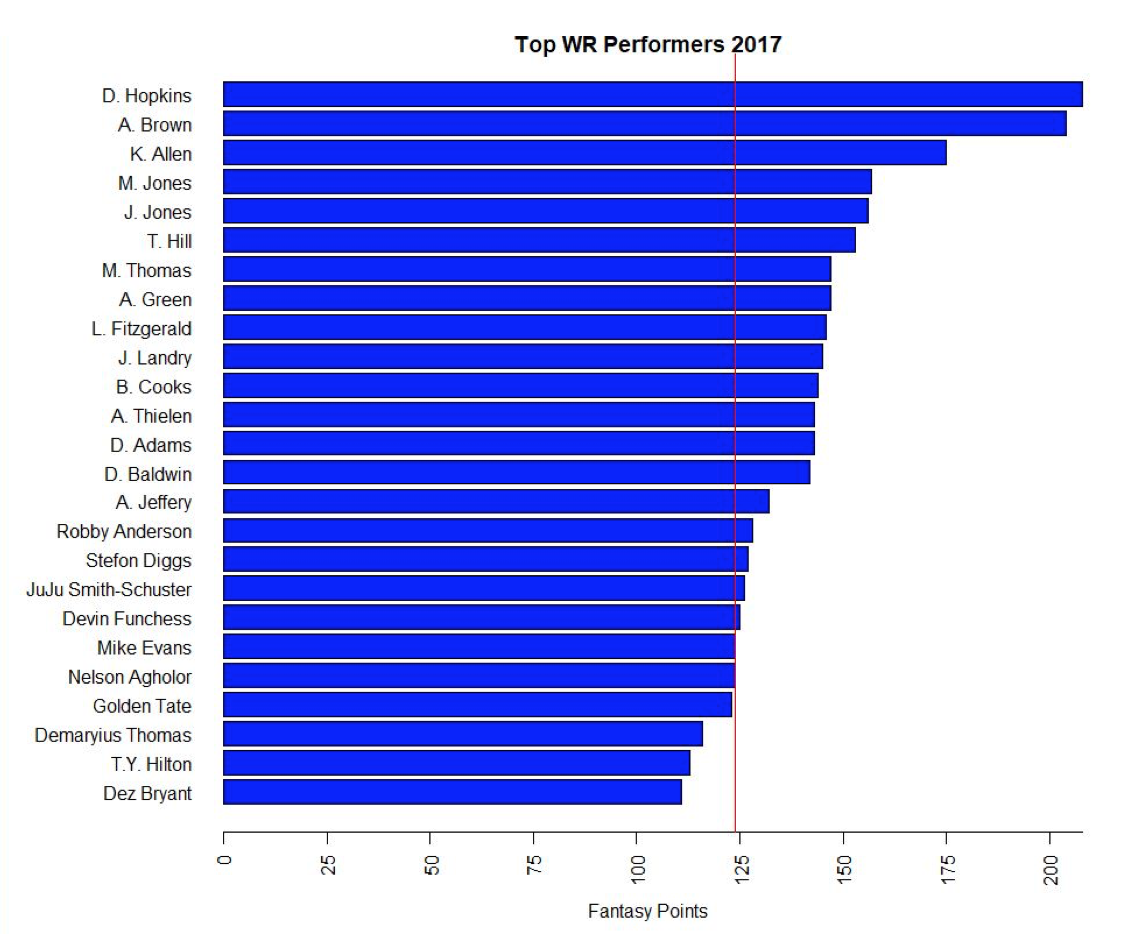
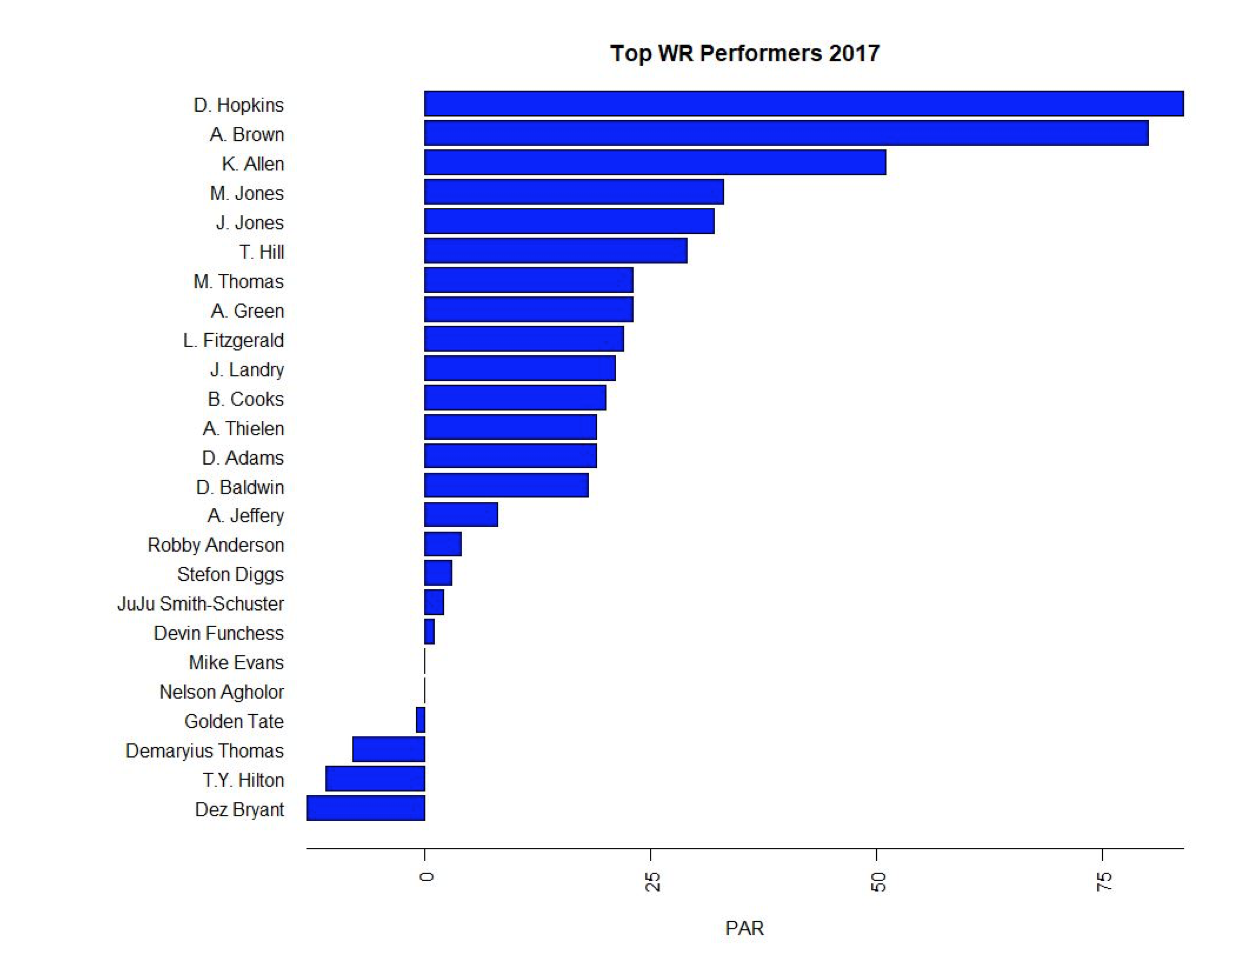
WRs tend to score less points than RBs which makes sense because they typically get the ball on far fewer plays per game. Even so, the incredibly quick decline we see in the plot below shows how valuable having a top WR would be. Not only is Deandre Hopkins or Antonio Brown going to outpace a typical free agent or bench WR, they’ll consistently win matchups with the starting WRs on other teams.
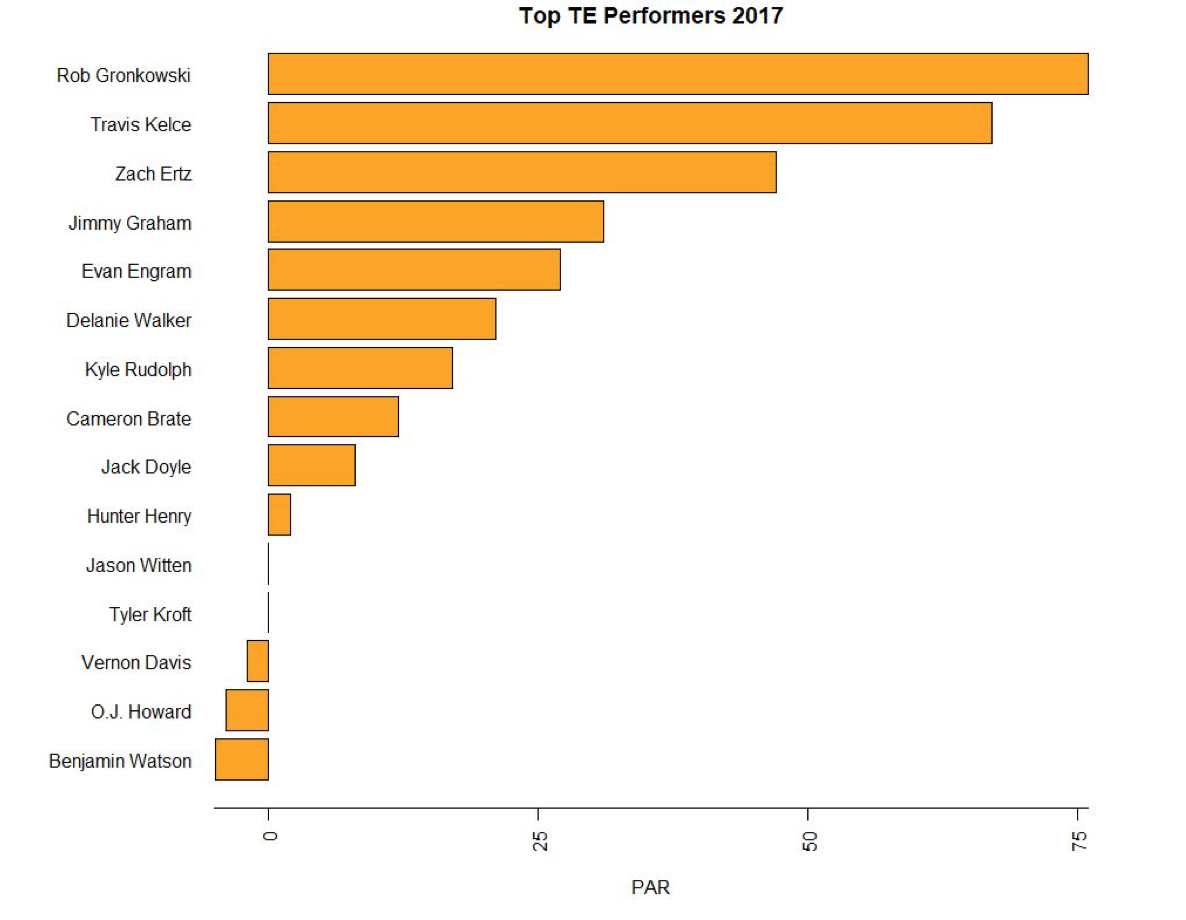
We’ll see with TEs below that because the ceiling seems to be lower, so to does the PAR value.
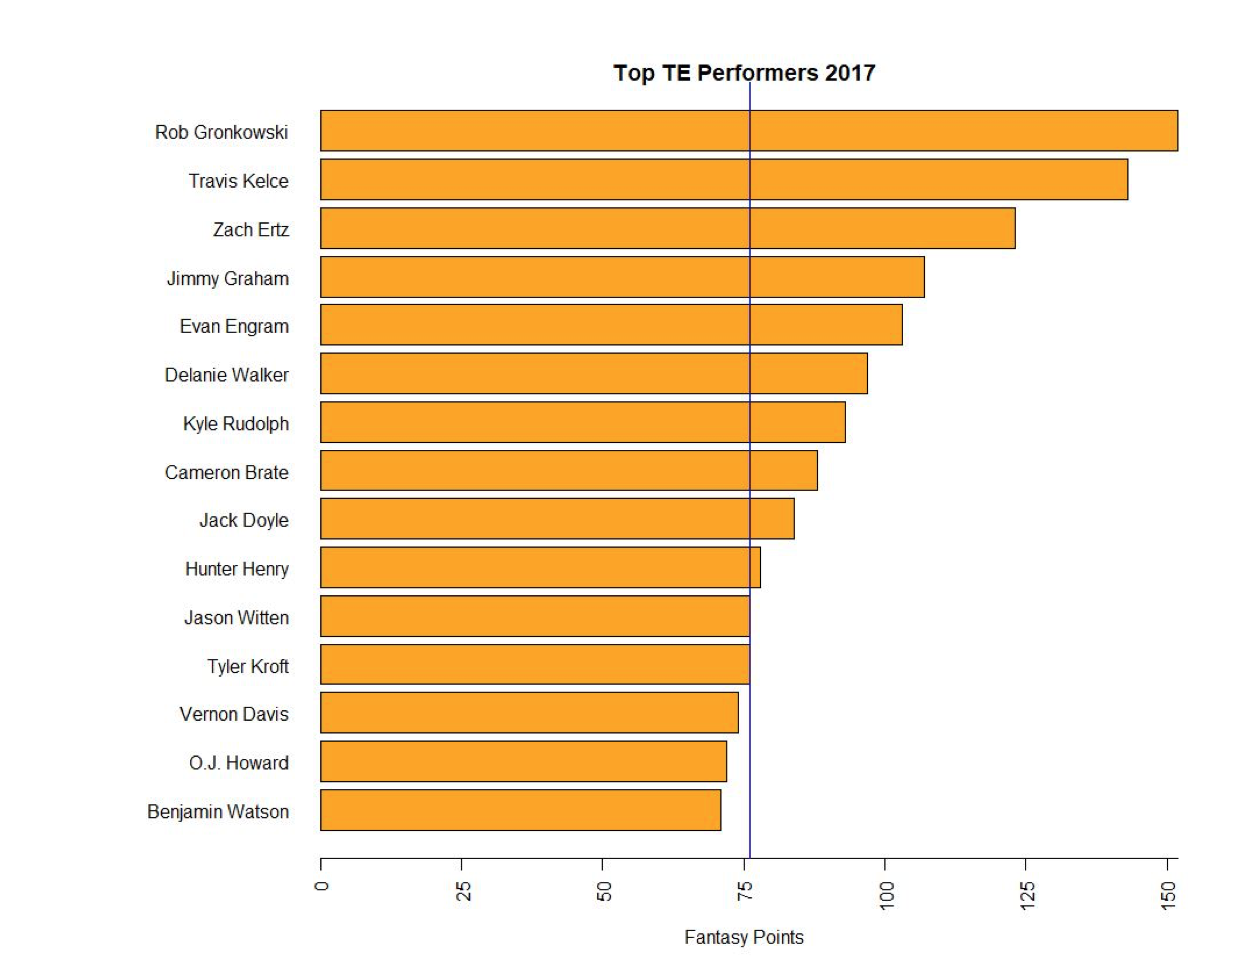
The Top TE this year, and most years, scores as many points somewhere around the 10th best WR, and usually in the range of RBs that aren’t starting in a typical 10 team league. Because of that, the total value they can add to a team is naturally lower. There’s also a pretty steep decline in TE performance outside the Top 10, with 2017 having only 9 TES that averaged 5 or more points per game.
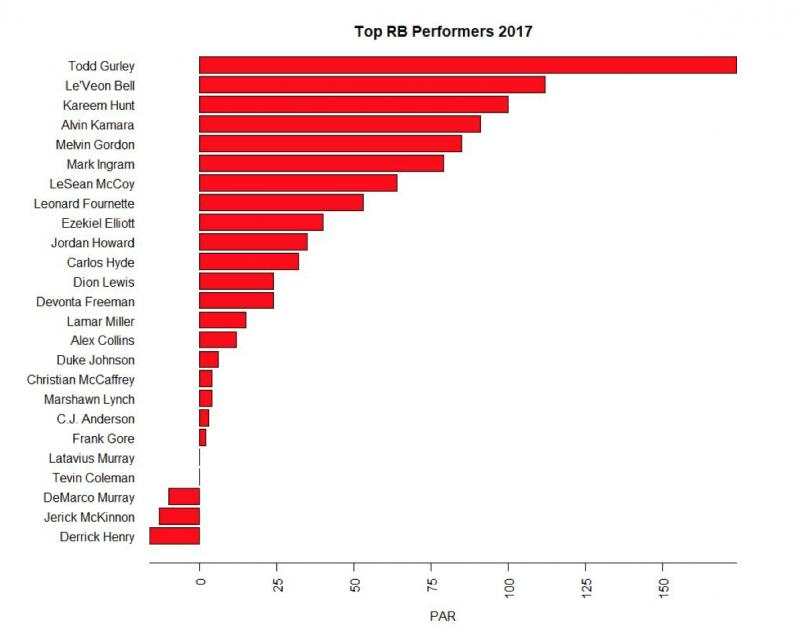
After looking at each of the offensive positions, we can take a look at the players with the highest PAR values to see which players added the most value to fantasy teams this year, as opposed to just scoring the most points.
This graph shows every player who returned a positive PAR value for the 2017 season. Todd Gurley seemed to have been in a league of his own this year. This graph is also a good deal more colorfully diverse than the first graph in the article, showing how PAR allows us to compare players performances independent of their absolute scores. While the top 10 true scoring had 9 QBs and 1 RB (yes Todd Gurley was really that good), the 10 players in terms of value added included 6 RBs, 2 WRs, 1QB, and 1 TE. These are pretty typical numbers (be on the look out in the future for analysis of past Fantasy seasons) and they go to show the power of a good RB for a fantasy team. The statement “I have a top 5 RB on my team” should carry more weight than “I have a top 5 QB or WR on my team.” (This is all under the pretense that if you had the #1 player at a given position you’d be bragging about that fact specifically). Moreover, the above graph shows that self-proclaimed fantasy expert Matthew Berry is well off-base when he award this year’s Fantasy MVP to Antonio Brown.
Let’s lay out a scenario. I have the 8th pick in my Fantasy draft. In the first round, 4 RBs, 3WRS, and 1 TE have been chosen. In a vacuum where the only knowledge I have about each player is their positional rank, I would choose the RB, because starting caliber RBs will add more value, usually, than starting caliber WRs, even compared with players ranked slightly higher at a different position.
It basically comes down to this: (We’ll actually be going more into this point in a piece in the Spring) Choosing one of the offensive players predicted to finish highly at that position correlates to finishing position. The #1 player is almost never the #1 finisher, but is usually still going to produce positive value, this year being an obvious exception. My heart goes out to all the former David Johnson owners out there. While the top WR, QB, and TE (meaning 1 or 2 of each) will compare to high level RBs, the sheer number of RBs who add high value to their team means that choosing a RB projected to finish high will have a greater probability of panning out than a top WR or QB, because unless they’re the creamiest of the cream of the crop, they won’t produce as much value as a typical starting RB1.
Another aspect of the season I wanted to look at was how the players that added the most value to their team came into the 2017 season. The black line has slope 1 (not a fitted line), and corresponds to a hypothetical player whose rank stayed the same, thus separating underperformers with overperformers. Players shown with preseason rank 201 were not ranked to start the season.
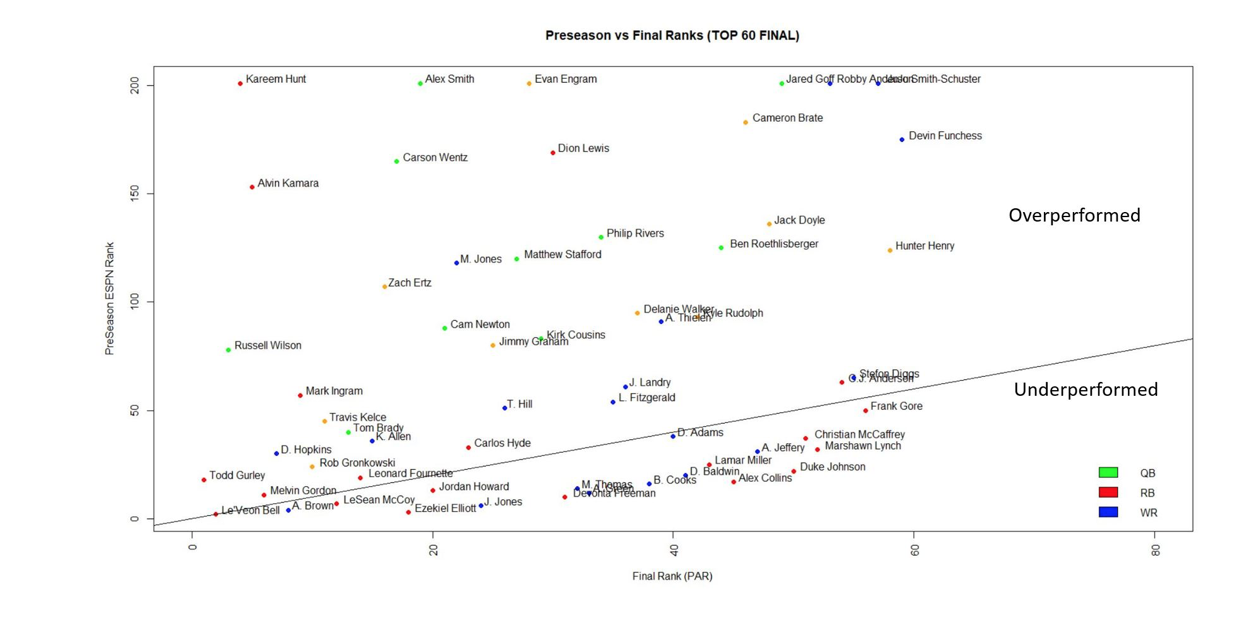
Apologies for some of the names being difficult to read due to overlap but this plot shows players Preseason ESPN draft rank compared with their final rank based upon value added. The players that added positive value are shown. We see a lot of players producing high value for their teams who were not projected to be drafted highly. This is mainly due to the way ESPN compiles their rankings, putting a lot of emphasis early on in WRs and especially RBs. This isn’t necessarily a bad thing. The thing about RBs and WRs is that they’re risky. Big name QBs get injured less than big name WRs and RBs because they get hit less (or at least are supposed to). In a lot of cases, the QB you draft can start the entire season for your fantasy team and will typically do well because QBs have less of a tendency to bust than RBs. At least a few RBs projected to do well will miss more than 12 games in a typical season. Because of this, RB depth, especially early in the draft where the chances of positive value being added are higher, is important. The injury frequency of RBs necessitates their priority, not only of starters but of bench depth, that isn’t the case with QBs.
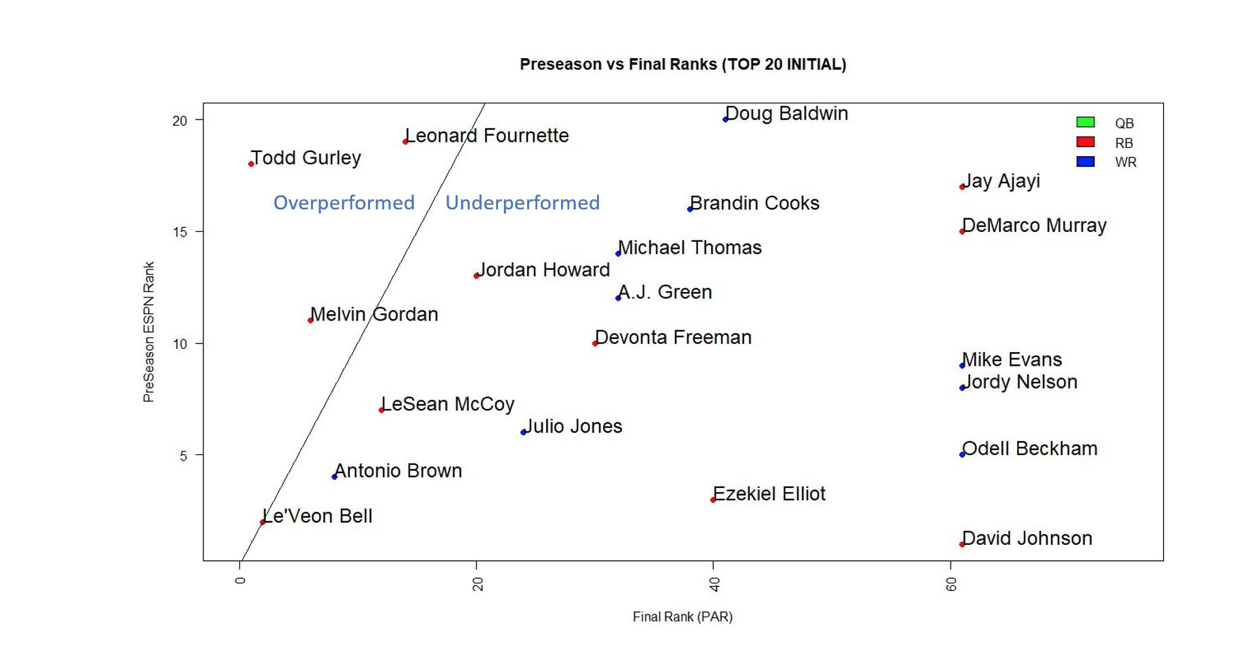
On the other side of the conversation, how abut the players projected to do well? The above plot shows the final Rank, in terms of value added for the players projected to be drafted in the top 20. Players with negative value added are shown by having the final rank of 61. The important takeaway of this plot is that while only 20% of the players in the top 20 preseason outperformed their rank, 70% added value to their team, all 14 of them upwards of 20 points as shown in the plot below. While a few big busts soured the season, having a player ranked in the top 20 was usually as asset for a team. There doesn’t however, seem to be a strong correlation of performance within the top 20. This means having more players of this caliber to start the season, rather than the top players within this section would be preferable. This is the curse of the #1 pick, getting the #1 and the #20 player. Because the #1 player doesn’t have a significantly higher chance of domination than any other player in the top 20 (and is usually a RB so has a higher injury chance), trading this player on day 1 for two other players, perhaps another first round pick and someone looming just outside the top 20, would be a steal. Feel free to try that move next year.
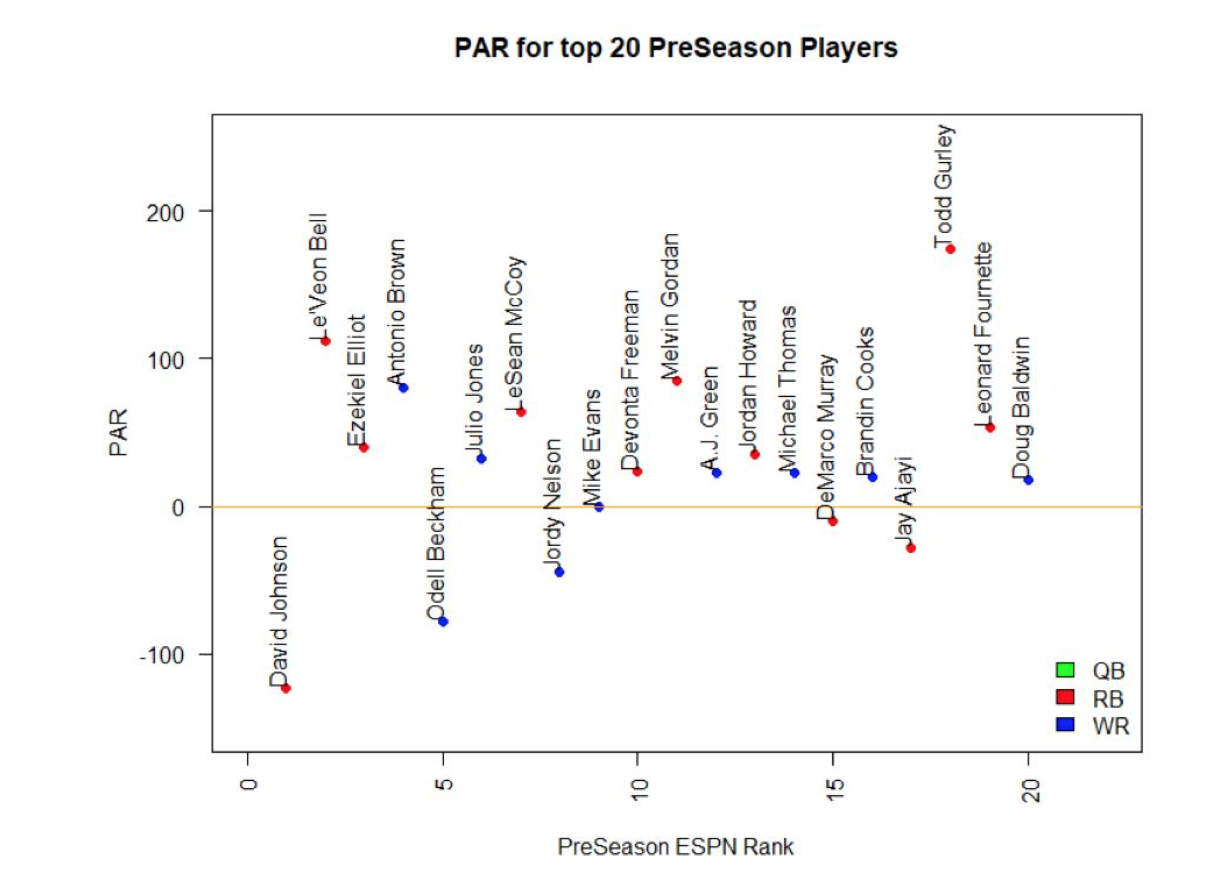
Looking at the value added by the top 20 players to start the season, we see that only 5 of them contributed negative value to their team. This plot makes the point fairly clear that within the top 20 there doesn’t seem to be that much correlation of starting position and value added. Maximizing players that have a high chance of adding value (RBs and WRs within the first few rounds) is far more important than getting the players predicted to be taken at the very top of a typical fantasy drafts. Enjoy the NFL playoffs everyone, thanks for reading!