By: Luke Benz
April 4, 2018
Author’s Note: The orginal version of this article was written for the Yale Daily News as part of our BY THE NUMBERS series. This version has been updated to include relavent graphics present in the print edition but not the online version of the article. The original online article may be found here.
The first week in April is one of the most exciting stretches on the sports calendar. It brings with it the first meaningful baseball games since October and tight playoffs races in the NHL and NBA. Perhaps no event is more exciting, though, than the Final Four and the crowning of the men’s and women’s NCAA basketball champions.
On Monday, Villanova beat Michigan to cap off an NCAA Tournament that was one of the wackier ones in recent memory. Despite falling short of the title game, Loyola-Chicago and team chaplain Sister Jean provided fans with a memorable run that will not be soon forgotten. Nevada pulled off an improbable 22-point comeback in the final 10 minutes of a game to upset powerhouse Cincinnati. And who could forget UMBC becoming the first No. 16 seed in men’s tournament history to beat a No. 1 seed in upsetting Virginia, stealing hearts — and busting brackets — in the process.
Was this iteration of March Madness actually more improbable than past years, or did the multitude of compelling storylines just make it seem that way? I dove into the numbers to find out. Because there is no database from which to pull historical data for the women’s tournament in the script R, I have focused only on the men’s tournament.
I began by compiling a database of NCAA tournament games since 1985, the year in which the tournament switched to its current, 64-team format. For each tournament, I looked at the sum of seeds for teams advancing past each round. The higher the seed sum, the more upset-heavy a given tournament was. I then took the average seed sum for each round to establish a baseline of what a typical tournament has looked like over the past 34 years. Finally, I used the differences between the given year’s seed sum for each round and the baseline seed sum — with each round in the tournament given more weight than the last — to create a metric called “Tournament Madness Factor.” This metric measures how “mad” a given NCAA Tournament was as compared to a typical tournament.
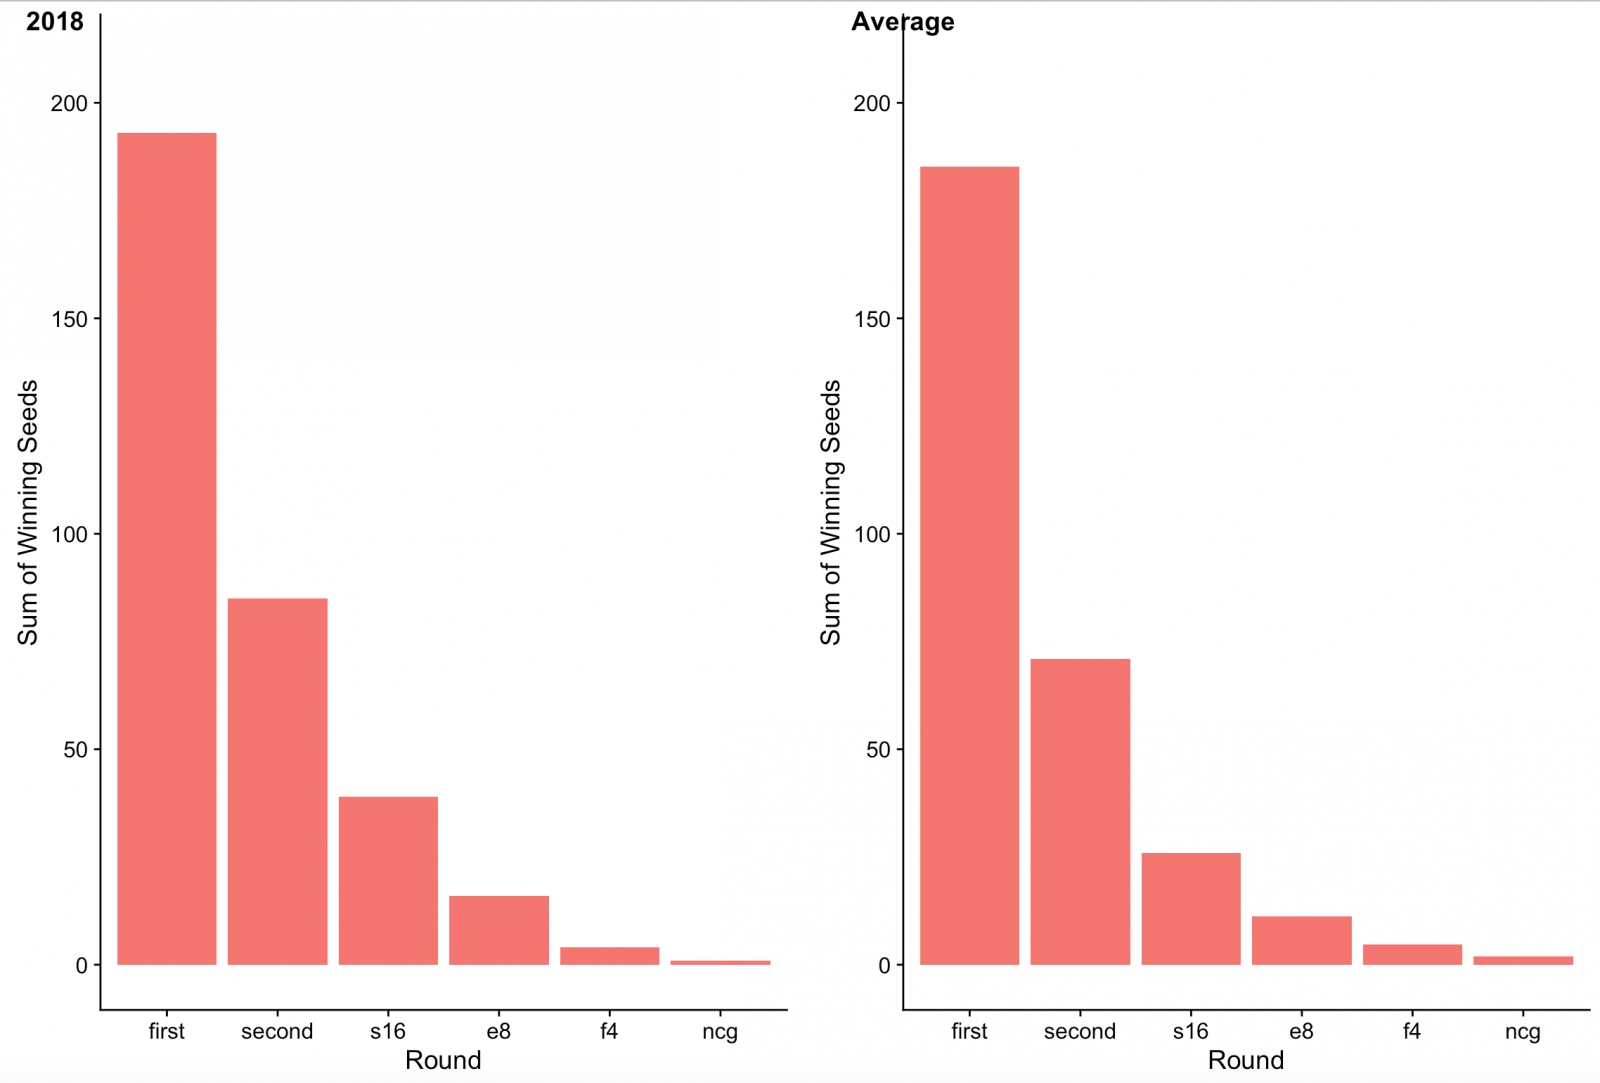
The 2018 tournament’s TMF of 84.7 makes it the third craziest of all time, behind only the 2014 (143.7 TMF) and 2011 (142.7 TMF) tournaments. In the 2014 NCAA tournament, No. 7 seed Connecticut beat No. 8 seed Kentucky in the national title game, and No. 11 seed Dayton made it all the way to the Elite Eight. The 2011 Final Four featured No. 8 seed Butler, No. 11 seed VCU, No. 3 seed Connecticut and No. 4 seed Kentucky. In fact, the sum of the seeds in that Final Four, 26, makes is the highest of any tournament since 1985. Interestingly, Connecticut was in the 2011 National Championship as well, meaning that it has been the beneficiary of the two craziest tournaments of the modern era.
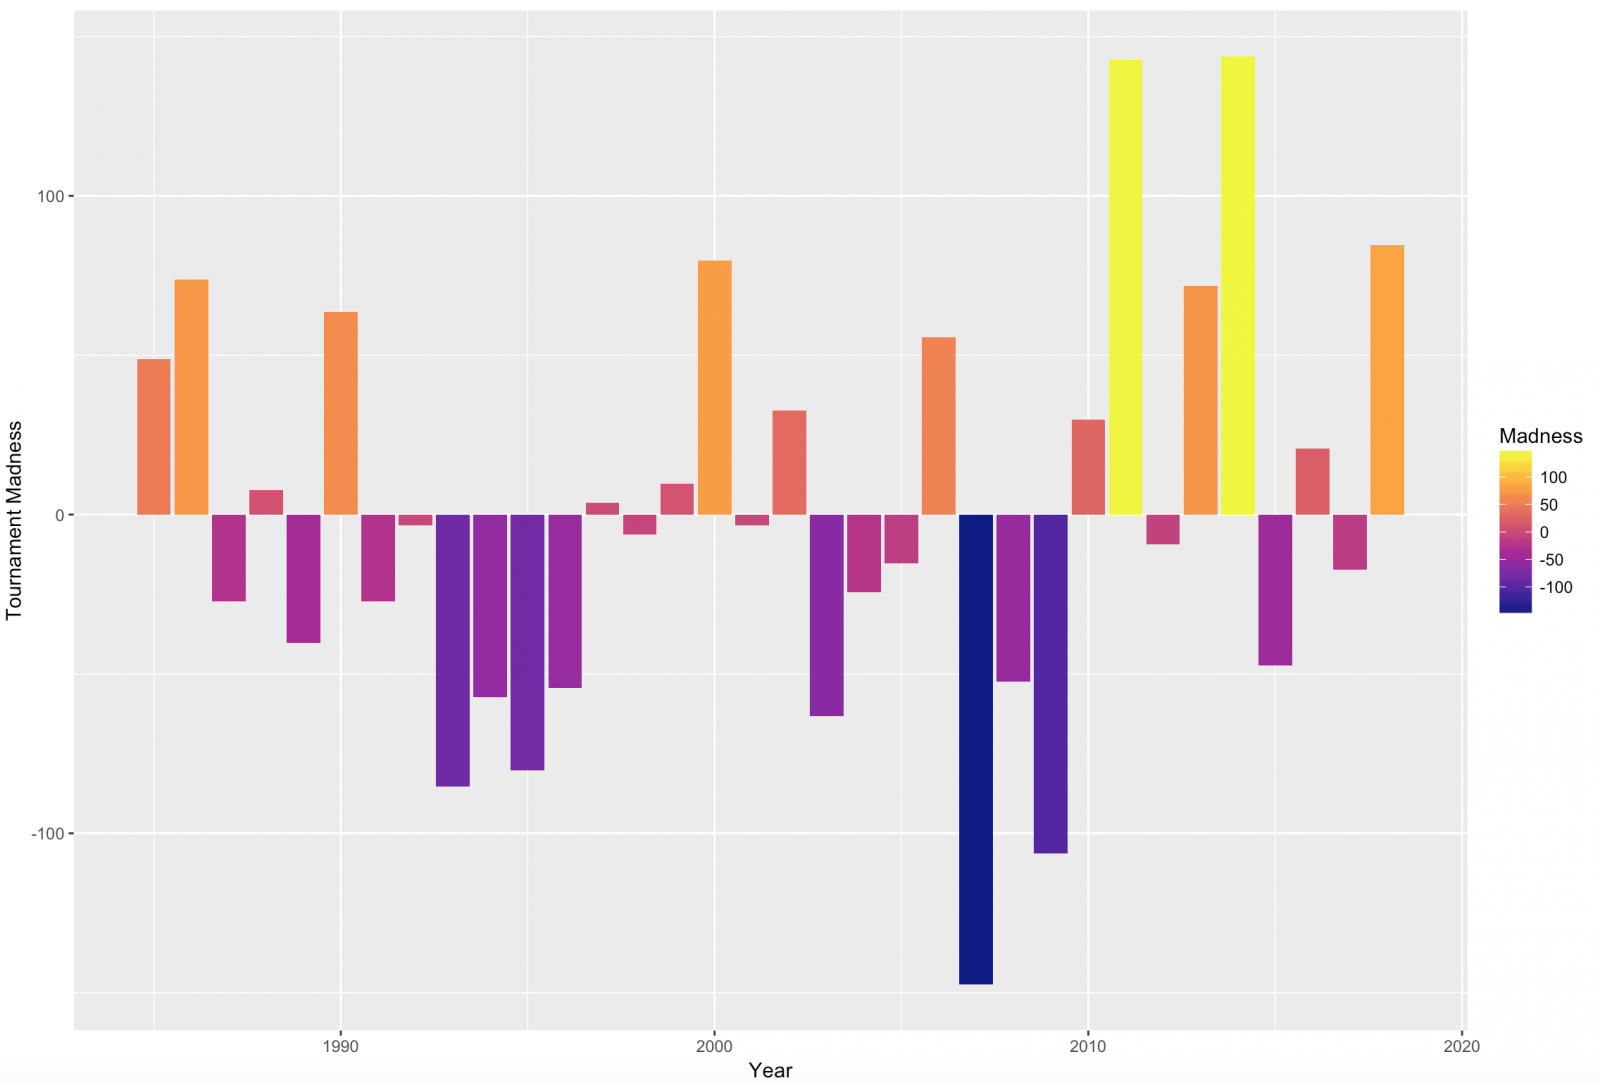
Overall, the 2007 NCAA tournament featured the most instances of top seeds winning. It’s TMF of -147.3 speaks to the lack of upsets — and makes 2007 the furthest tournament from average. The 2007 tournament demonstrates an oft-ignored fact about upsets in March Madness, namely that a lack of upsets is just as unlikely as an abundance of upsets. In the average tournament, we should expect to see at least a few throughout the bracket.
TMF is by no means a perfect way to measure how unpredictable a given tournament is. To begin with, using weights relative to the rounds in the tournament discounts upset-heavy opening rounds.
Moreover, TMF only looks at the end results of games and makes no distinction between blowouts and buzzer beaters. That said, TMF confirms what our gut instincts told us about the past few weeks of college basketball — any way you slice it, 2018 was one of the “maddest” Marches on record.