By: Luke Benz
March 13, 2018
A few months ago, I debuted a version of game excitement index that predicted the quality of a game based on the strength and relative gap between the two teams. While this metric had sucess in identifying the best games, the scale for doing so is not very good, and it tells us nothing about the quality of a game after it’s been played.
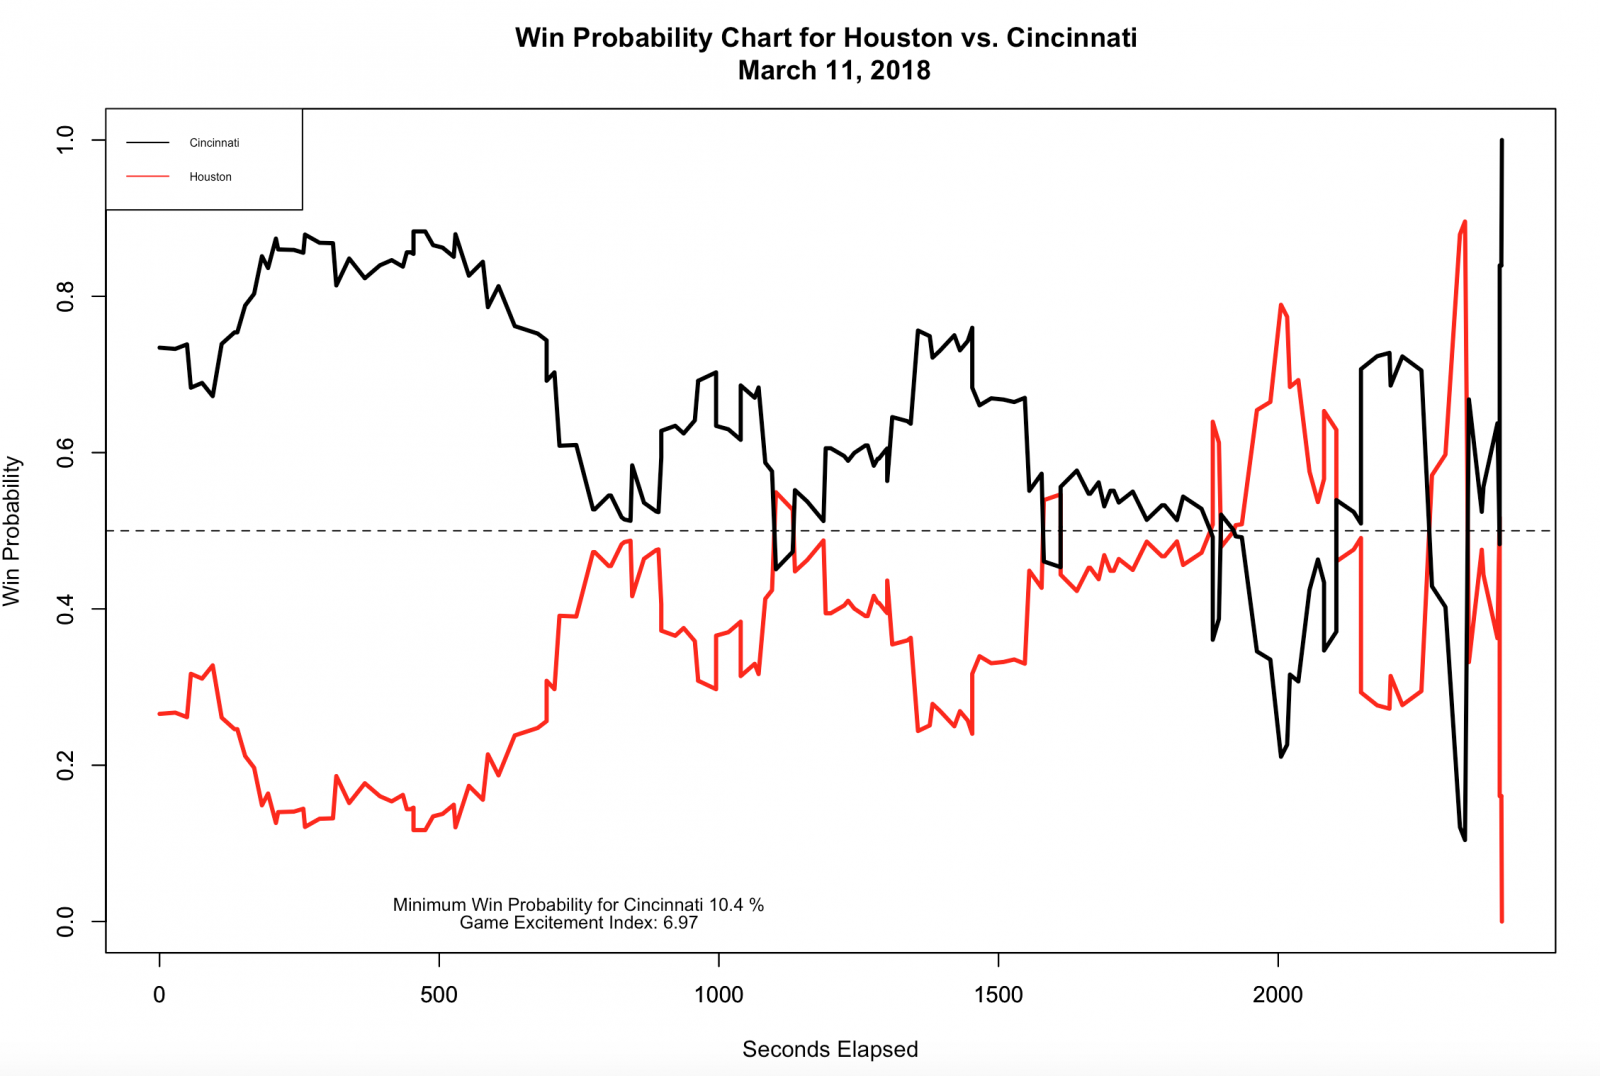
Thus, using my college basketball in-game win probability model, I sought to create a play-by-play derived version of GEI that more accurately refelected the excitement of game. Using previous work from FiveThrityEight and Brian Burke, I derived the following as my GEI formula:

Essentially, the formula sums the absolute value of the win probability change from each play, scaling the total so that overtime games aren’t automatically more exciting because they have more plays than non-overtime games. The results seem satisfying so far! Here’s the newest version of my win probability charts from the 2018 American Conference championship game.
